
Sample information
Chart of sample sizes :
BioProjects of each species :
Select Species:
| Species | BioProject | LibraryLayout | SampleSize | Breed |
|---|---|---|---|---|
| Baboon | PRJNA386932 | SINGLE | 766 | Unclear |
Reference genome version
| Species | Reference Genome Version |
|---|---|
| Chicken | Gallus_gallus.GRCg6a.dna.toplevel.fa |
| Crab-eating macaque | Macaca_fascicularis.Macaca_fascicularis_5.0.dna.toplevel.fa |
| Cow | Bos_taurus.ARS-UCD1.2.dna.toplevel.fa |
| Chimp | Pan_troglodytes.Pan_tro_3.0.dna.toplevel.fa |
| Fruitfly | Drosophila_melanogaster.BDGP6.22.dna.toplevel.fa |
| Dog | Canis_familiaris.CanFam3.1.dna.toplevel.fa |
| Green monkey | Chlorocebus_sabaeus.ChlSab1.1.dna.toplevel.fa |
| Horse | Equus_caballus.EquCab3.0.dna.toplevel.fa |
| Mouse | Mus_musculus.GRCm38.dna.toplevel.fa |
| Baboon | Papio_anubis.Panu_3.0.dna.toplevel.fa |
| Pig | Sus_scrofa.Sscrofa11.1.dna.toplevel.fa |
| Rabbit | Oryctolagus_cuniculus.OryCun2.0.dna.toplevel.fa |
| Rat | Rattus_norvegicus.Rnor_6.0.dna.toplevel.fa |
| Rhesus | Macaca_mulatta.Mmul_10.dna.toplevel.fa |
| Sheep | Ovis_aries.Oar_v3.1.dna.toplevel.fa |
| Worm | Caenorhabditis_elegans.WBcel235.98.dna.toplevel.fa |
| Clawed frog | Xenopus_tropicalis.Xenopus_tropicalis_v9.1.dna.toplevel.fa |
| Zebrafish | Danio_rerio.GRCz11.dna.toplevel.fa |
APA event summary
| Species | APA events identified by DaPars2 | APA events identified by QAPA |
|---|---|---|
| Baboon | 2657 | 2401 |
| Chicken | 25600 | 20680 |
| Chimp | 11524 | 14447 |
| Clawed frog | 19782 | 18164 |
| Cow | 17203 | 17741 |
| Crab-eating macaque | 29269 | 26956 |
| Dog | 16837 | 14066 |
| Fruitfly | 7332 | 8572 |
| Green monkey | 13922 | 14645 |
| Horse | 11149 | 7186 |
| Mouse | 54448 | 53710 |
| Pig | 36280 | 24441 |
| Rabbit | 7687 | 7442 |
| Rat | 19605 | 20378 |
| Rhesus | 29138 | 20625 |
| Sheep | 7029 | 4189 |
| Worm | 17218 | 18459 |
| Zebrafish | 16272 | 21589 |
How to query
Query APA events
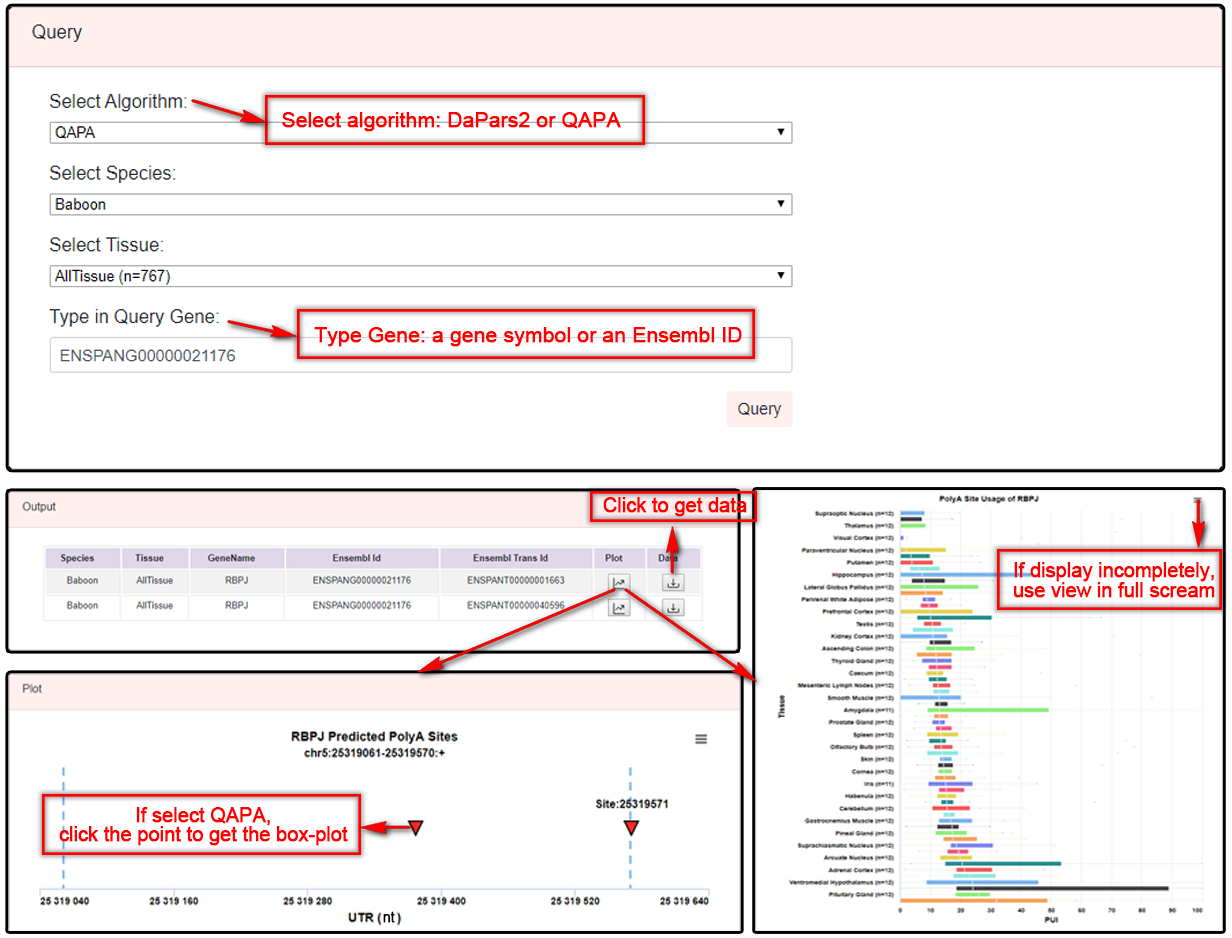
Users can select an algorithm [Dynamic Analyses of Alternative Polyadenylation from RNA-seq (DaPars2) or RNA-seq Quantification of Alternative Polyadenylation (QAPA)], species (default: Baboon) and tissues (default: AllTissue), and query APA events by typing a gene symbol or Ensembl gene ID in the search box. A table with species, tissue, gene symbol, Ensembl ID and Ensembl Trans ID of queried APA events will be shown. Users can click the "plot" button to view the position graph including gene's 3'UTR extracted from DaPars2 and the position of poly(A) sites. For DaPars2, this method only predicts single proximal site, and the distal site using end of 3’UTR by default, so the position graph just shows proximal sites and the boxplot graph shows distal Ploy(A) site usage (PDUI). For QAPA, this method can get the usage of multiple sites by annotation site file, so users need to click the point on the position graph to get the boxplot graph. (Note: the number of samples in the plot represent the number of samples that have APA events, which could be different from the original sample size.)
Query PAS
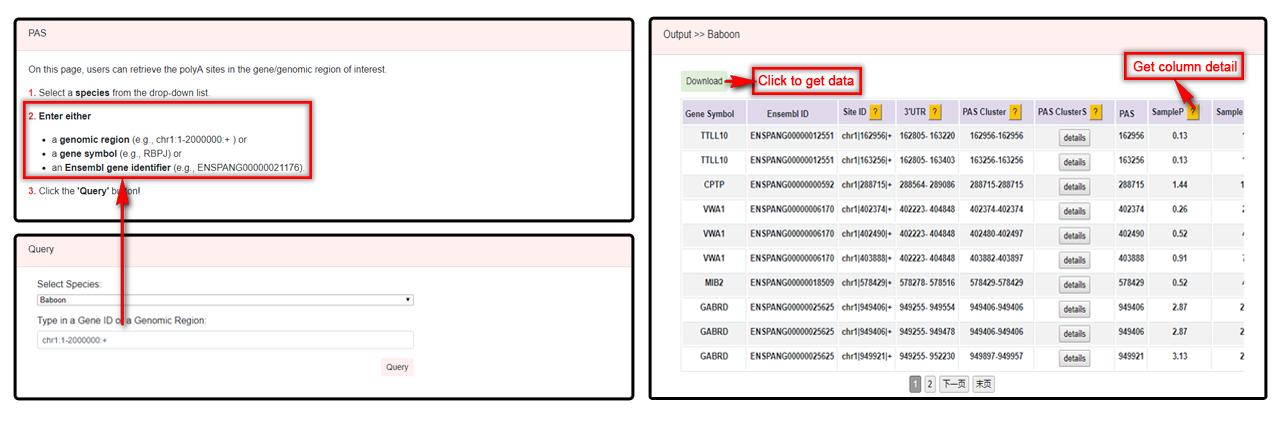
Users can select a species and typing a genomic region such as chr1:1-2000000:+, gene symbol or Ensembl ID to query PAS cluster. Details of cluster with gene symbol, Ensembl ID, site ID, species, 3'UTR [extracted from DaPars2], PAS cluster, PAS clusterS, PAS, sampleP, sampleS and signals will be displayed in the table. Users can click the "Download" button to download the queried data, or click the "?" button for more information.
Query APA Motifs
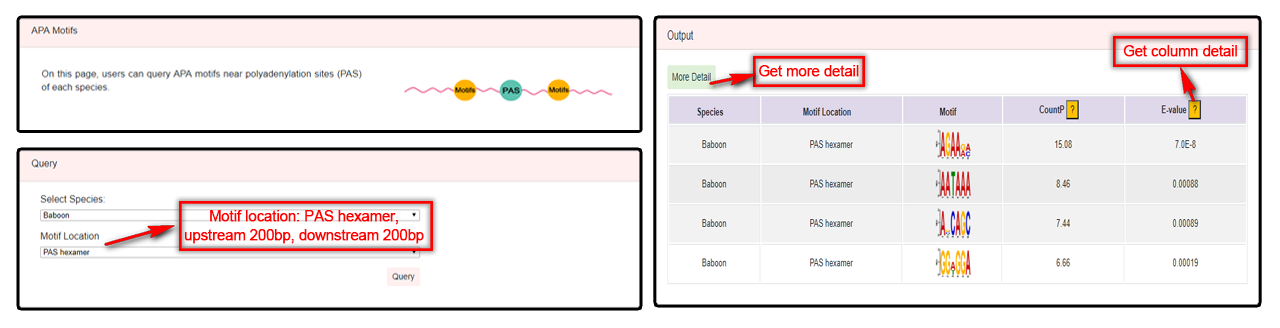
Users can select species and motif location (contain PAS hexamer, upstream 200 nt, downstream 200 nt) to query APA motif. A table with species, motif location, motif, countP and E-value will be returned. By clicking the “More Detail” button, Users can get reports from MEME or DREMW tool.
Methods
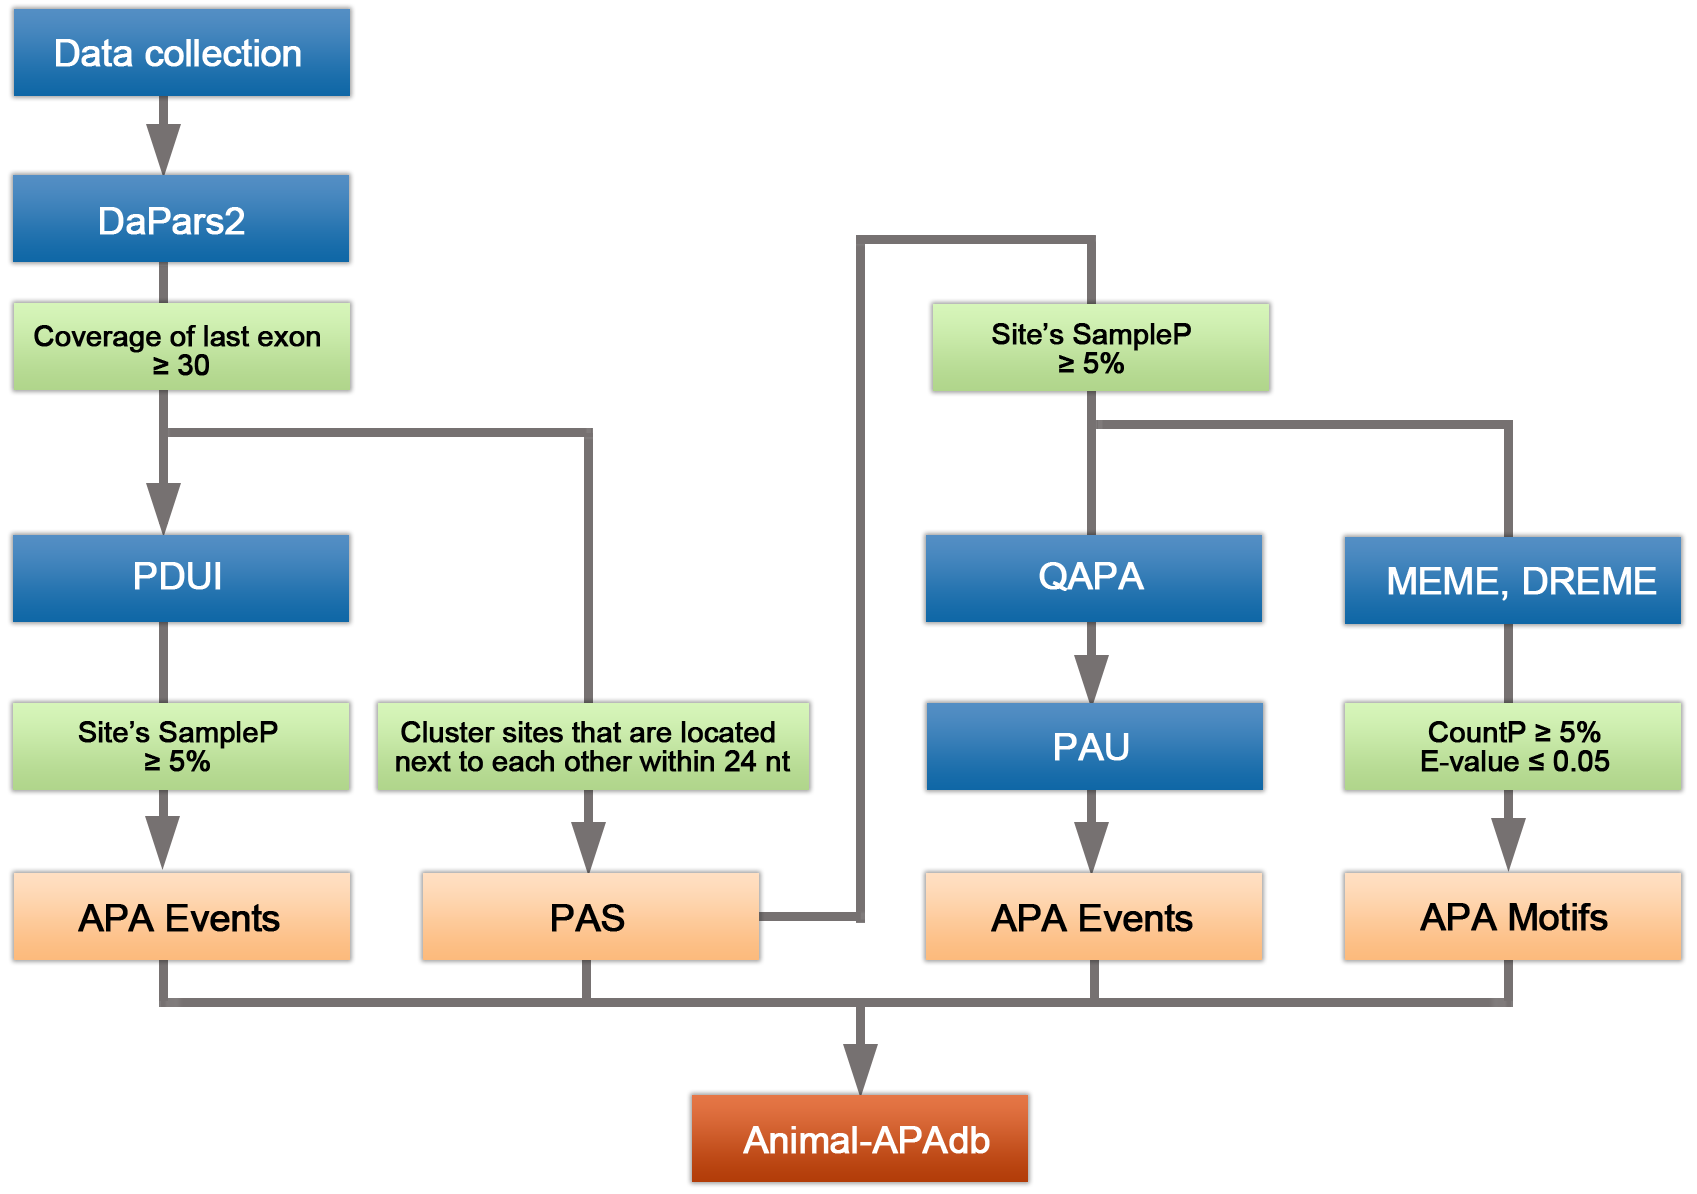
Database construction pipeline
Differences of two algorithms
DaPars2 is based on detecting read density fluctuations in RNA-seq data
DaPars2 is the next generation of DaPars that directly infers the dynamic alternative polyadenylation (APA) usage by comparing standard RNA-seq from multiple samples. Given the annotated gene model, DaPars2 can infer the de novo proximal APA sites as well as the long and short 3'UTR expression levels. Finally, the dynamic APA usages of each samples will be identified.
QAPA relies on priori annotations of poly(A) sites
QAPA (quantification of APA) employs an expanded library of annotated poly(A) sites to refine 3'UTRs and quantify relative abundance of APA isoforms. It first curates a library of 3'UTR isoform sequences by refining existing 3′ UTRs or adding new 3′ UTRs based on additional poly(A) site annotation sources. These new 3'UTR sequences are then used to measure transcript-level expression of 3'UTRs using a pseudo-alignment tool called Sailfish, which is the main difference between QAPA and many other methods. Then the relative usage of a 3'UTR isoform (called PAU, Poly(A) Usage) was calculated as the normalized expression of a 3′ UTR over the total expression level of all 3'UTRs in a gene. The change of APA site usage is measured by the PAU of the proximal poly(A) site.
Note
Required files used in DaPars2 and QAPA process can be obtained through the steps suggested by the official documents (QAPA and DaPars / DaPars2). And it was very important that 3'UTR annotation region in this website was extracted from DaPars2.
Quantification of APA
The annotation of last exons were collected from the UCSC and Ensembl. Two different algorithms were used to calculated APA events for each gene in each tissue from different species. For DaPars2, we calculated the percentage of distal poly(A) site usage index (PDUI) of APA events, and required that the average normalized reads of each 3'UTR region is ≥ 30. And at the same time, we deleted the sites which the SampleP was < 5%. For QAPA, it can calculate the poly(A) usage (PAU) by ploy(A) site annotation files from GENCODE basic poly(A) annotation track, PolyASite or custom file. We filtered sites which sampleP was < 5% and add PolyASite's annotation file which sampleP was ≥ 5% for mouse and worm.
PAS and PAS cluster definition
Since the position of PAS predicted by DaPars2 is relative inconsistent in different samples, we grouped the sites into a cluster according to the rule that the distance of site position is less than 24 nt. For a gene, the median position of a PAS cluster is usually the most representative site among samples, so we chose the median site as PAS.
APA Motifs
PolyAdenylation is the result of an RNA processing reaction, where a multiprotein complex assembles on specific sequences on the pre-mRNAs, called the cleavage and polyadenylation signals (pA signals). pA signals consist of sequences that flank either side of where the pre-mRNA is endonucleolytically cleaved and subsequently polyadenylated. The classic pA signal is a bipartite sequence element that usually consists of a PAS hexamer, upstream motifs and downstream motifs of the cleavage site. In our analyses, we scanned the 50 nt upstream sequence of the poly(A) site to find PAS hexamers. In addition, we also obtained motifs in upstream 200 nt and downstream 200 nt from the ploy(A) site using MEME tool.
Citation
Animal-APAdb: a comprehensive animal alternative polyadenylation database
Weiwei Jin† , Qizhao Zhu† , Yanbo Yang , Wenqian Yang , Dongyang Wang , Jiajun Yang , Xiaohui Niu* , Debing Yu* , Jing Gong*. Nucleic Acids Research.(2020)